Tour the live demo
Tour Vaanieval review workflows using synthetic localhost screenshots, with a separate link to the hosted demo and clear measurement limitations.
demo.vaanieval.com is a curated call snapshot for exploring the review workflow, not an endpoint for uploading your recordings. Browser-local settings and alert rules can change in your browser without changing the shared call dataset. No anonymity claim is made for demo content.
Use it to decide whether Vaanieval surfaces the evidence you want to capture.
The demo previews the call console, fleet views and browser-local alert rules.
The local dashboard from
vaanieval-observer-backend
also includes these review surfaces. GitHub repositories are public;
hosted-beta backend work is separate and does not certify public SaaS
readiness. Screenshots below are from an isolated localhost instance, not
the hosted demo: three synthetic tool-only calls, with no customer data or
provider requests. The hosted demo may differ from this local fixture.
Source installs and hosted beta
The repositories are public and support anonymous Git access. These guides install the SDKs from public Git. Anonymous registry checks on 20 September 2026 returned HTTP 404 for npm @vaanieal/observer and PyPI vaanieval-observer; no release was found under those names. Source availability does not mean the hosted service is ready for public launch: new public workspaces remain closed.
The quickstarts pin published Python 0.5.7b1 and Node 0.1.1-beta.1 source previews. Both installed previews have uploaded synthetic calls to the isolated hosted development environment. Git/build tooling and explicit revision upgrades are required; this is not registry publication or production-readiness certification.
For setup help, email shubham@vaanieval.com or book a call.
Start with one call
The call view is the heart of the product: everything else is a way of finding which call to open.
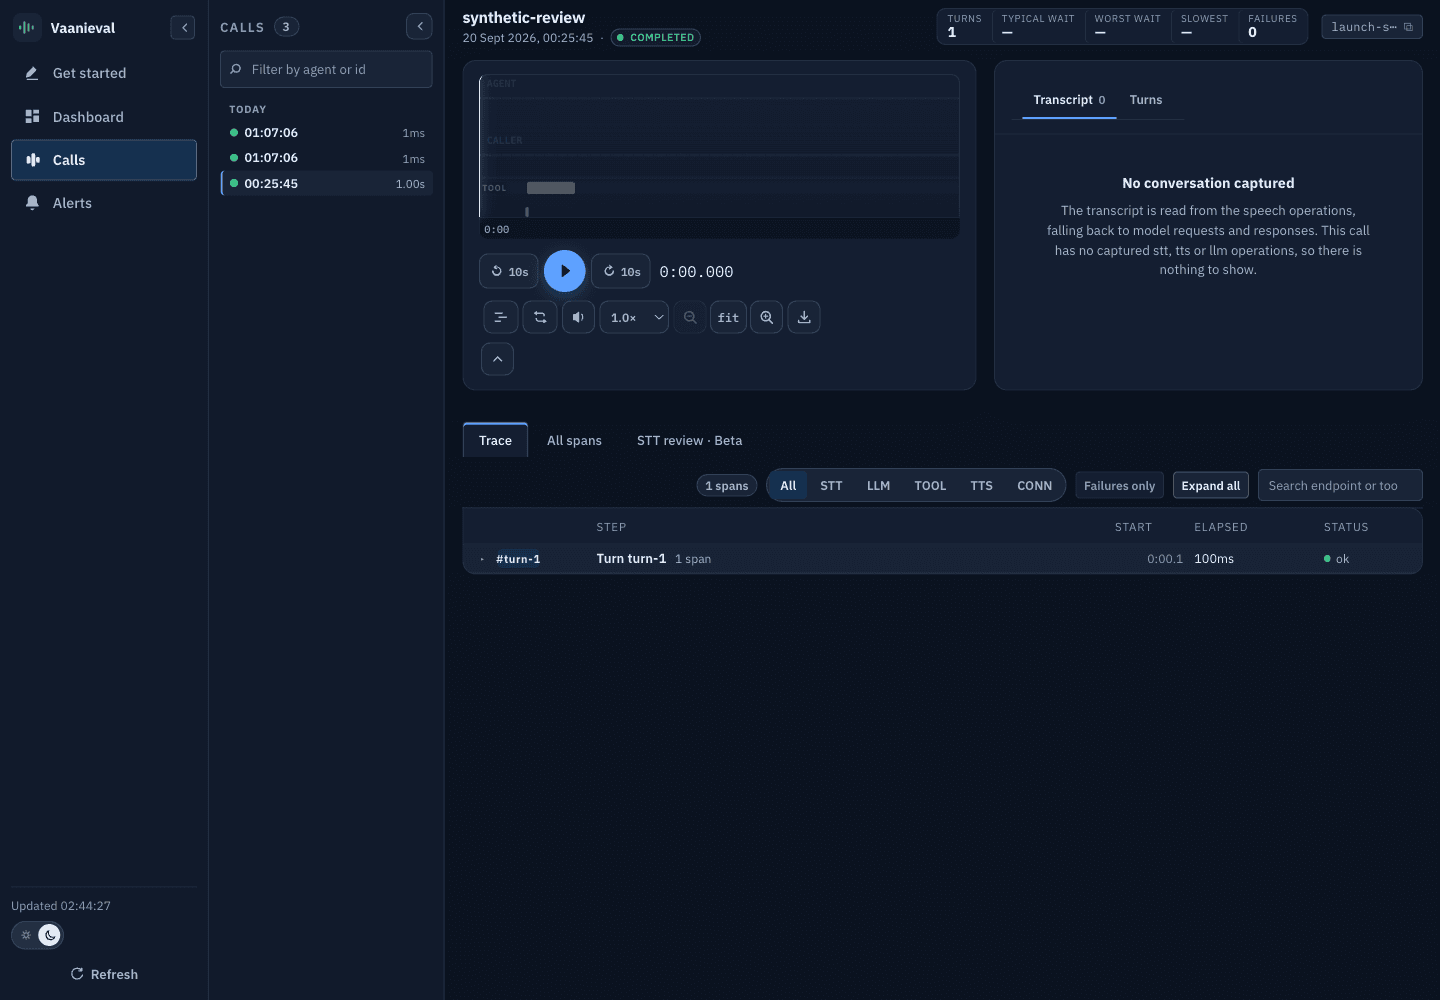
Four things to look at, in order:
The header strip
TURNS, LENGTH, TYPICAL WAIT, WORST WAIT, SLOWEST, FAILURES, TOOLS,
PROVIDERS. "Typical wait" and "worst wait" are the caller's experience — the
gap between the caller finishing and the agent starting to speak — not a
service's response time when those measurements are available. This synthetic
tool-only fixture has no measured voice timing; unavailable is not zero.
The waveform
The screenshot has one second of synthetic silent audio. It demonstrates the audio surface, not caller speech or a diagnosed provider delay. A real captured voice call needs audio and timing evidence before gaps can be attributed to transcription, a model or speech synthesis.
The transcript
The fixture contains no conversation, so there is no transcript to follow. This is deliberately absent evidence, not a claim that transcription was perfect or that a customer said nothing.
The trace
One tool span is present. There are no STT, LLM or TTS spans from which to derive listening, thinking or speaking timing.
Expand a turn
Use the trace to inspect what was actually recorded.
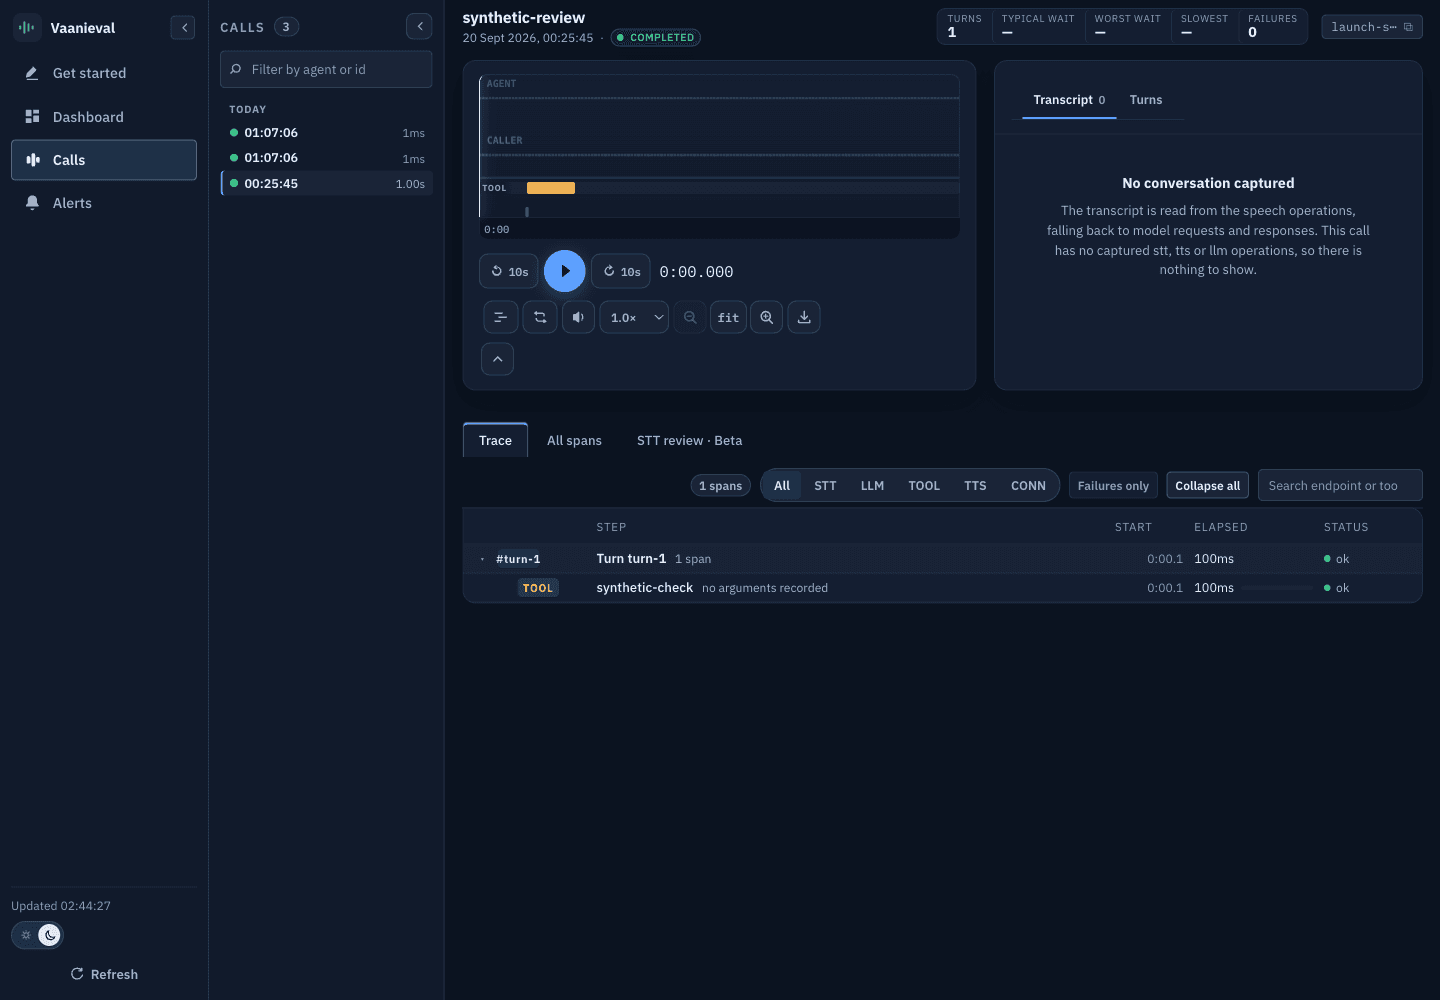
This screenshot does not demonstrate provider retries, barge-in or streaming speech milestones. Those require a suitably instrumented voice call. On such a call, milestone evidence can separate slow recognition from slow endpointing, and a framework span can group multiple captured HTTP attempts. See Reading a call for the interpretation rules.
Find the call worth opening
The Dashboard tab rolls the same measurements across a time range, agent, provider, model, SDK, environment and version.
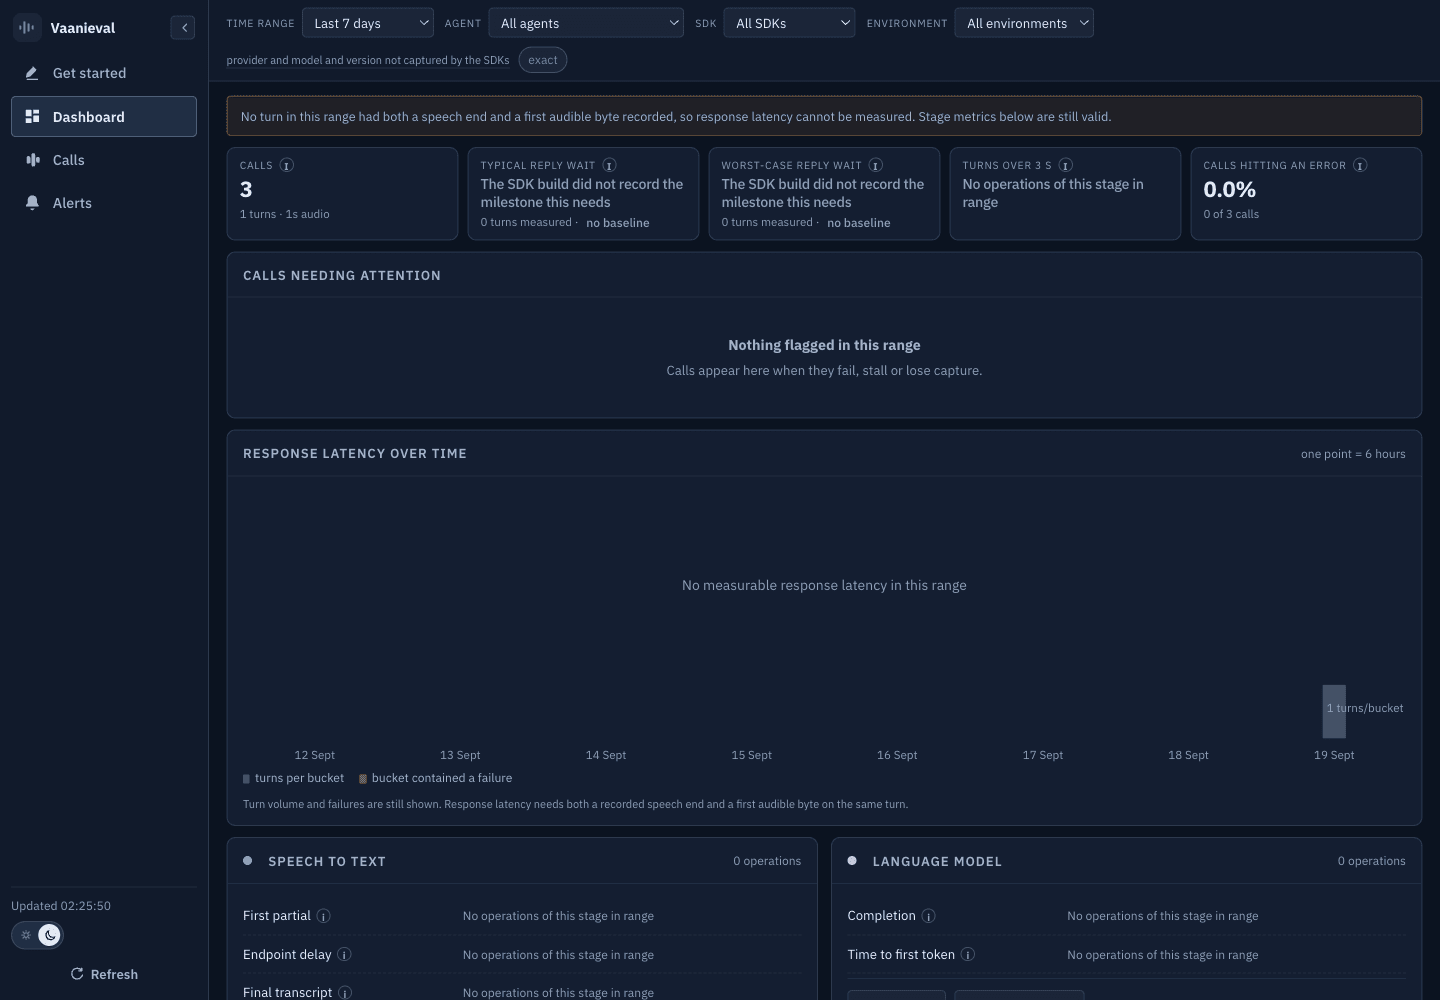
The three-call count is not evidence of three measurable voice conversations. This fixture has one recorded turn and no response-latency measurement, so there is no voice percentile to interpret. Check coverage before comparing agents or declaring a regression.
Calls needing attention ranks in three classes — failed (a recorded operation failed), unverifiable (capture is incomplete, so we cannot say what they heard) and slow — then by magnitude within each class. Opening a row lands on the turn that caused the flag, not the top of the call.
Preview alert thresholds
The Alerts tab previews rules against available calls while you inspect the page. It is not background monitoring.
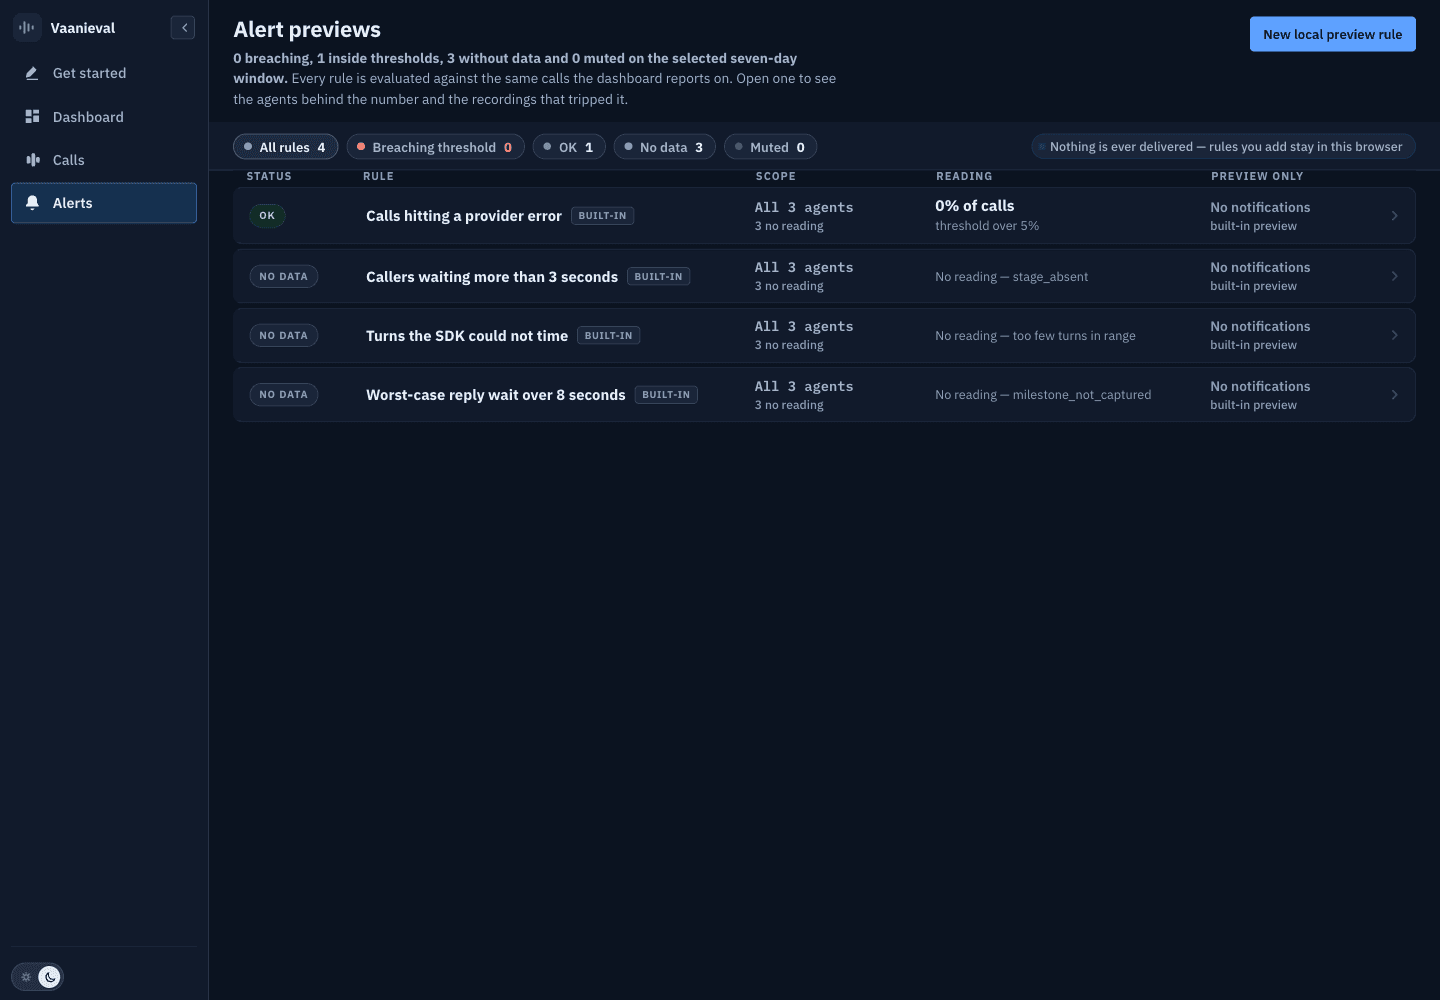
The captured preview is empty. Rules you add locally can be inspected against available readings; a missing reading does not mean healthy. Destination labels are previews, not connected notification integrations.
Nothing is delivered, in the demo or the local dashboard. Rules you add stay in your browser; there is no email, Slack or webhook notification service.
Review the transcription
The STT review tab can display captured streaming timing and transcripts. The selected synthetic tool-only call has neither.
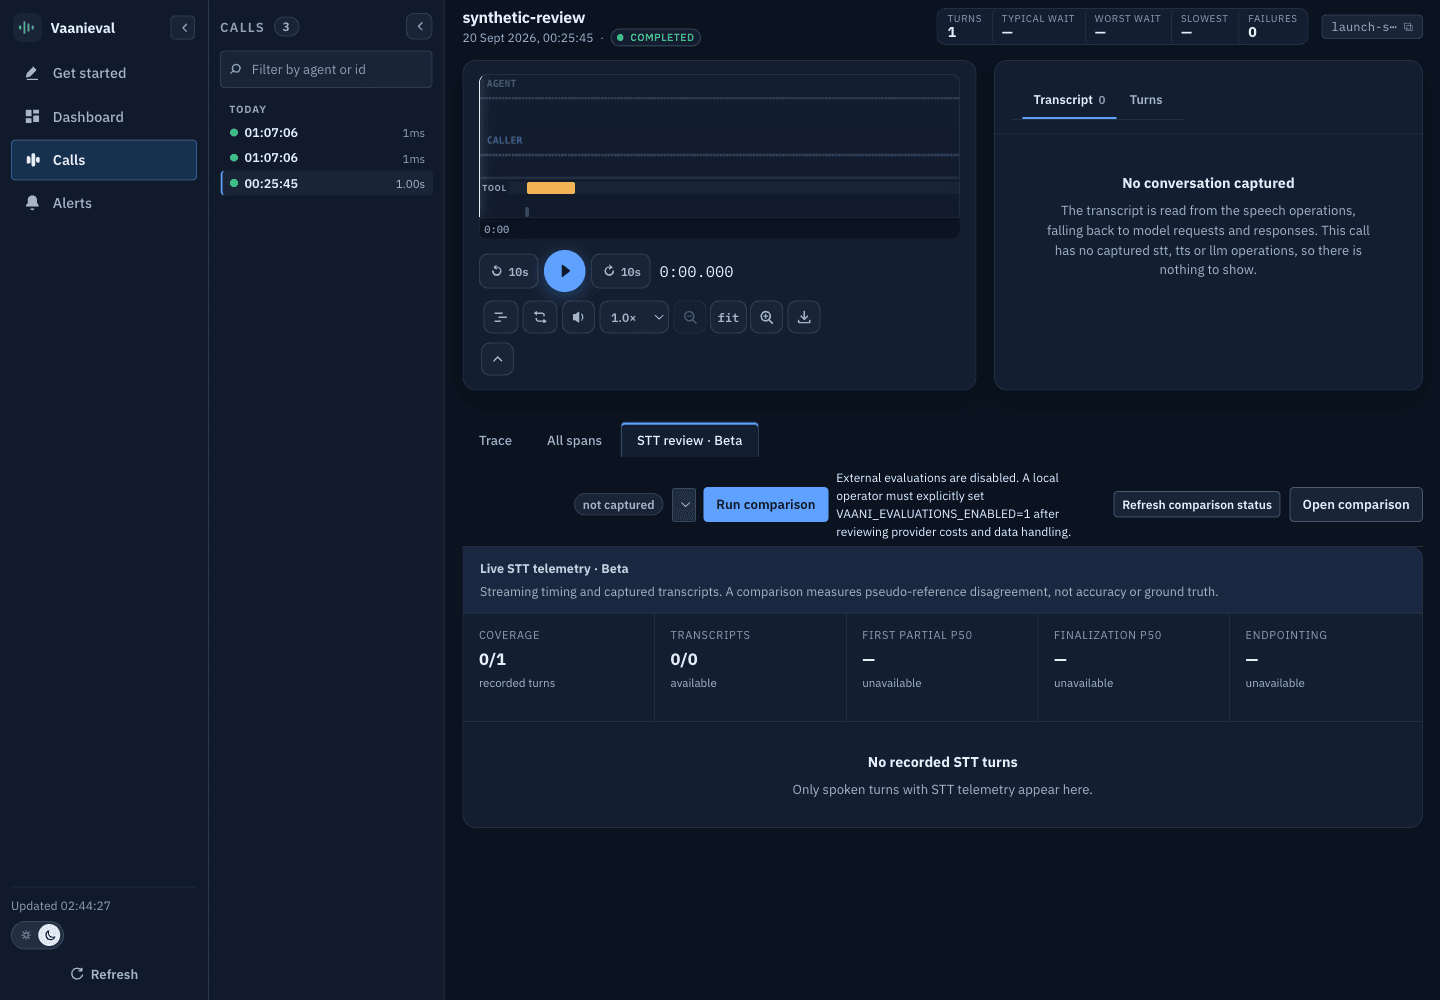
Two conventions to internalise:
—means unavailable, not zero. The screenshot has0/1STT coverage,0/0transcripts and all speech timing unavailable. Missing timing is never inferred from an operation's start and end times or from a batch HTTP round trip.- Model disagreement requires a comparison. A challenger transcript enables estimated WER, not ground-truth accuracy. External evaluation is disabled in this screenshot; no challenger or judge result is being shown.
Running a comparison produces an estimated WER, per-word substitutions, deletions and insertions, with optional judge output to help prioritise human review. In the local dashboard this is default-off, manual external processing: full caller audio goes to ElevenLabs and transcript judging to OpenAI, with current-policy confirmation required. The demo is not a promise that you can run live evaluations there. See STT evaluation and Metrics.
The challenger is a pseudo-reference, not ground truth. The score is labelled estimated WER / model disagreement, never accuracy, until a human-reviewed reference transcript exists.
Next
Record your own call (Python)
Ten minutes to the same view, running against your traffic.
Record your own call (Node.js)
Same, with automatic fetch instrumentation.
Metrics glossary
Exactly what each number means and when it is reported as unavailable.
Book a 20-minute walkthrough
See it running against your own traffic.