Reading a call
How to go from "this call went wrong" to "this stage caused it" using the waveform, the transcript and the trace.
The call view is where a debugging session actually happens. Everything else in the product exists to help you choose which call to open.
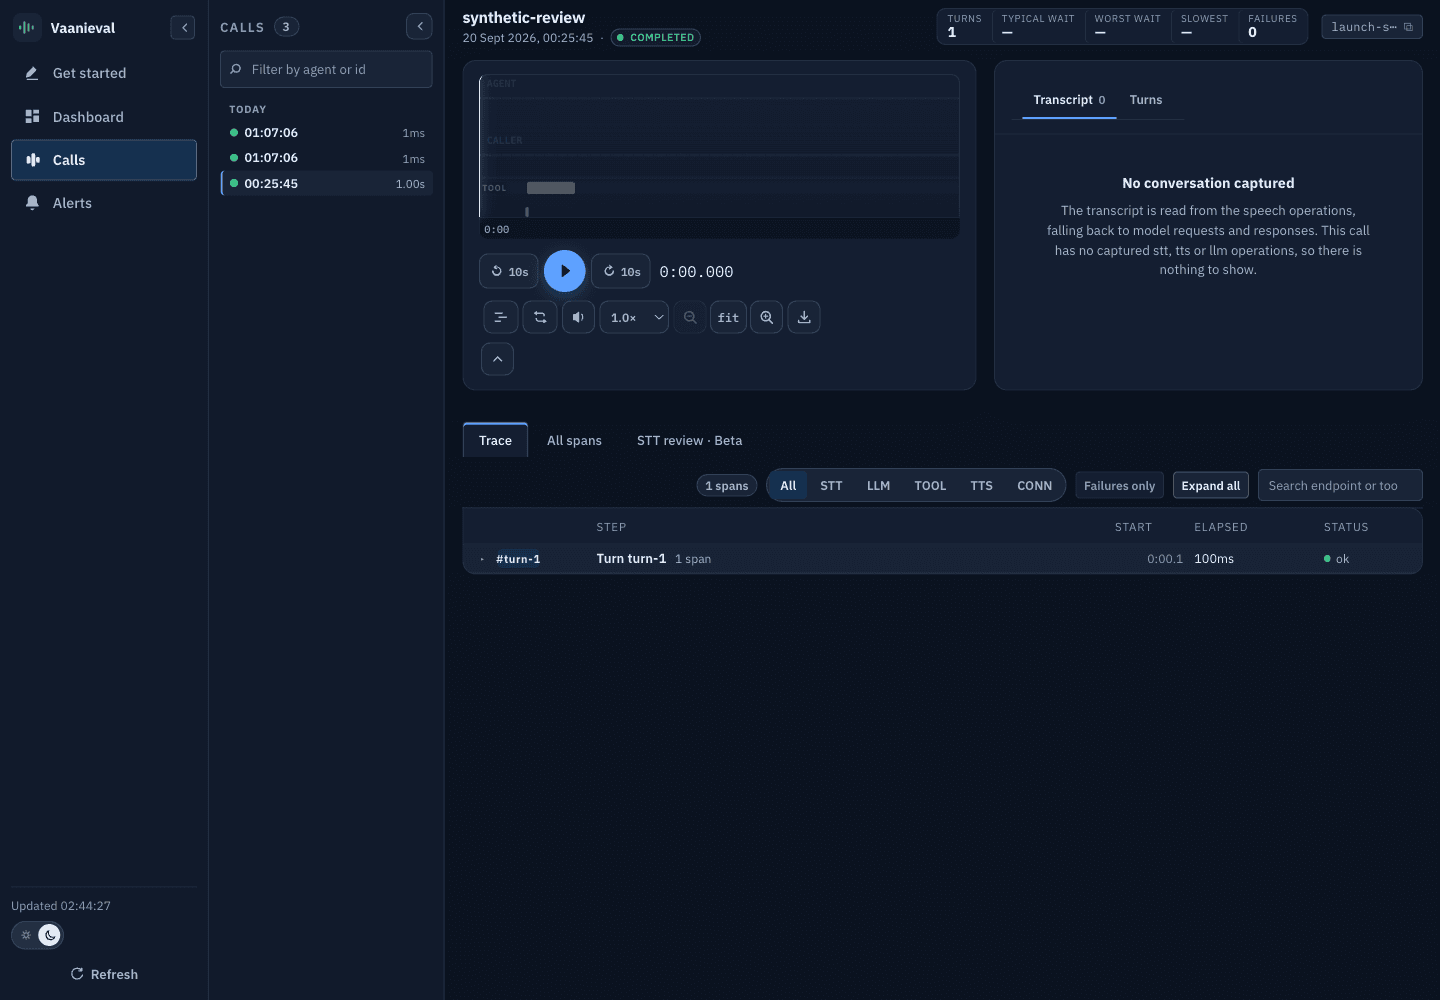
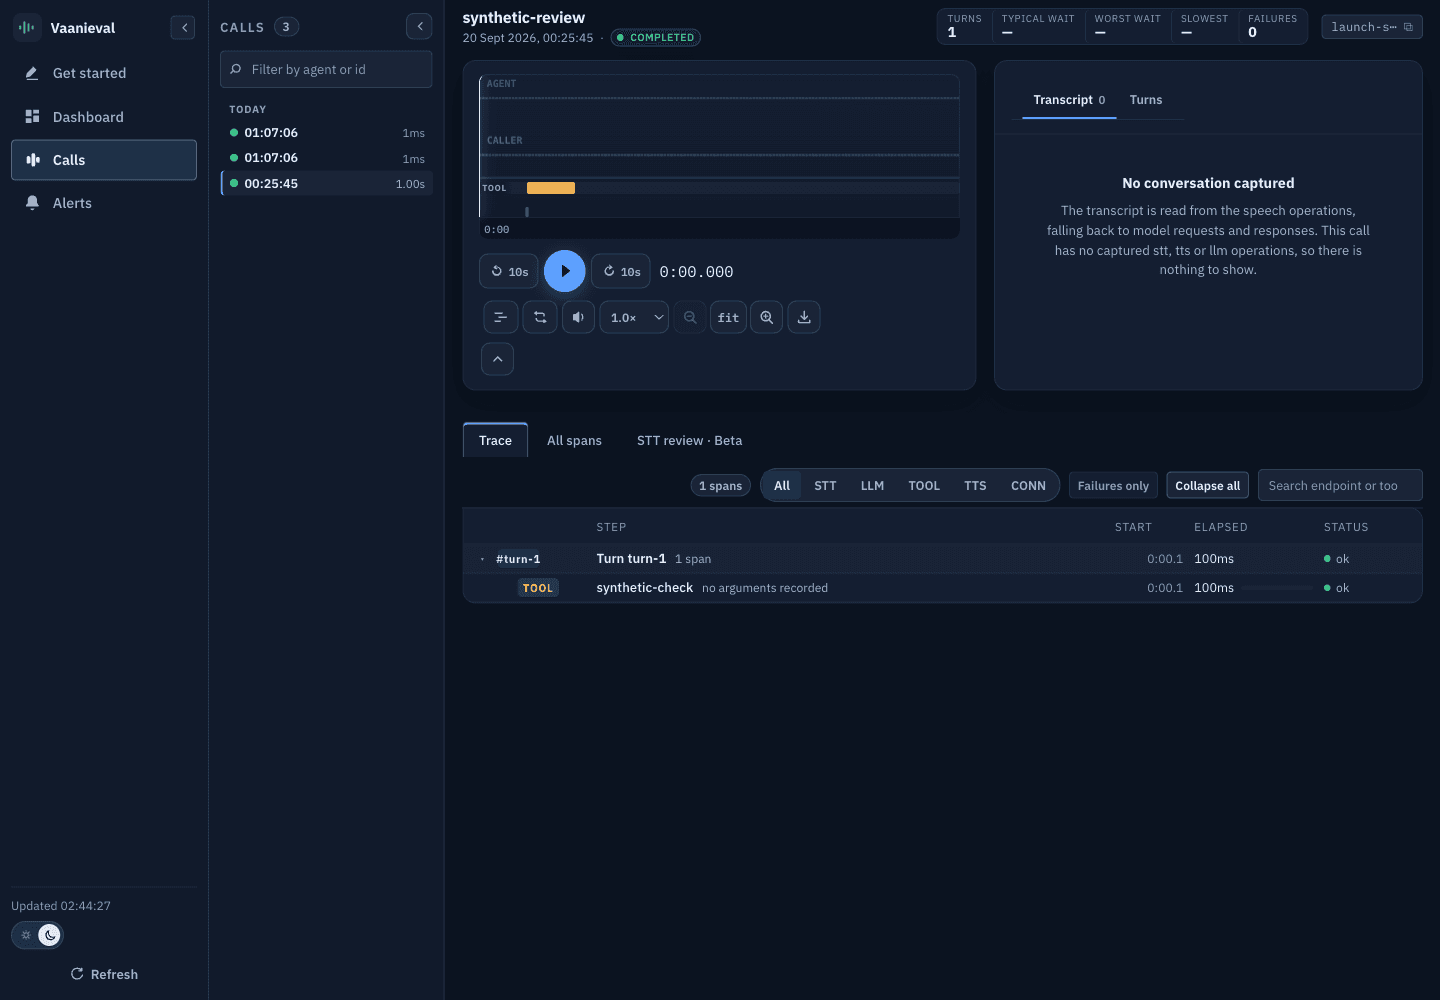
These 1440×1000 screenshots were captured from an isolated localhost instance using synthetic data. They contain no real customer conversation and required no provider calls. They are not captures of the hosted demo or hosted beta.
The header strip
| Field | Meaning |
|---|---|
TURNS | Exchanges detected in the call |
LENGTH | Recorded session duration; not necessarily the telephone connection's wall-clock duration |
TYPICAL WAIT | Median caller-visible reply wait |
WORST WAIT | The worst single reply wait |
SLOWEST | Which stage owned the worst turn |
FAILURES | Recorded failed operations, excluding recognised cancellation; not proof of a caller-visible failure |
TOOLS | Tool operations recorded |
PROVIDERS | Which STT, LLM and TTS providers served the call |
Duration semantics depend on the SDK revision. The unreleased checkout finalizers include recorded event ends and rendered audio tails, even when those extend beyond elapsed session time. See Session package.
"Wait" is the caller's experience, not a service's response time. It is measured from caller stops speaking to first audio byte — the silence the caller actually sat through. A provider that responds in 200 ms can still produce a 3-second wait if something downstream is slow.
The waveform
The screenshot contains one second of synthetic silence. It does not demonstrate a caller wait, speech synthesis or a diagnosed voice-stage delay.
For a voice call with the necessary captured evidence, the waveform places agent and caller audio on the same timeline and can associate gaps with recorded stages. Do not infer a stage's latency from silence alone.
Playback details worth knowing:
- Audio is stored once as raw PCM; the console requests an on-demand WAV wrapper rather than storing a second copy.
- The wrapper streams and honours HTTP
Range— Safari refuses to play media otherwise. - Waveform peaks are rendered server-side, one peak per pixel column, so a long call does not ship megabytes of samples to the browser.
- Agent left, caller right. The stereo composition is aligned on the session timeline, so the silences you see are the silences that happened.
The transcript
Captured conversation text can follow playback and be grouped by turn. This tool-only fixture has no conversation, so there is no transcript to display. An empty panel is not a perfect transcription score or evidence of a silent customer; here it reflects the deliberately limited synthetic input.
Transcript text only appears if stt_content capture was enabled for that call.
See Capture and privacy.
The trace
The current screenshot exposes the fixture's single tool span. It has no STT, LLM or TTS spans and no provider retries. In an instrumented voice call, expanding a turn lets you inspect the available spans and milestones rather than assuming all listening, thinking and speaking stages were captured.
Milestones split a duration into a diagnosis
In a voice call, an STT span carrying caller starts speaking → first partial transcript → caller stops speaking → provider marks speech final → final transcript → end of utterance lets you separate two failures that share a duration:
- Slow to produce text — a recognition problem.
- Slow to decide the caller finished — an endpointing problem.
This is a conceptual example, not evidence present in the tool-only screenshot.
Framework spans versus HTTP attempts
When both framework and HTTP instrumentation are enabled, a framework span can cover multiple captured provider attempts. Read those attempts together when investigating retries; one HTTP duration does not necessarily describe the whole model operation. No such sequence is present in this screenshot.
Cancellation is not failure
The dashboard recognises AbortError, CancelledError and CancelledException
and does not count them as faults. A TTS span aborted because the caller
interrupted is the agent behaving correctly. The annotation goes further and
checks whether caller speech actually overlaps — so a cancellation that was not
barge-in is flagged as worth looking at.
A workflow that works
Read WORST WAIT and SLOWEST
Check timing coverage before interpreting the wait. An acceptable measured wait does not establish transcript quality or overall call success.
Find the annotated silence on the waveform
It names the stage. Click it to jump the trace to that turn.
Expand that turn
Read the milestone list. The gap between two adjacent milestones is your answer.
Check for a framework span with multiple attempts
If the turn's duration is much larger than any single HTTP attempt, you are looking at retries, not a slow provider.
Listen
Scrub the waveform to that timestamp. What the caller heard is often not what the timings suggest — a 4-second wait filled with a "let me check that" is a very different experience from 4 seconds of silence.
When numbers are missing
A turn missing any milestone the dashboard needs is reported as unmeasurable and excluded from the percentiles, never estimated from operation start and end times. If a call shows a low measurable percentage, the finding is usually about your instrumentation rather than your agent — a provider wrapper that is not emitting milestones, or a code path that bypasses your endpoint rules. See Milestones and samples for the full convention.
Next
Self-hosting
Running the Vaanieval local dashboard — setup, configuration, external evaluation and operational limits, distinct from pending hosted beta work.
Fleet and alert previews
Reviewing captured measurements across agents and experimenting with browser-local threshold rules — without notification delivery.