Fleet and alert previews
Reviewing captured measurements across agents and experimenting with browser-local threshold rules — without notification delivery.
The local
vaanieval-observer-backend
includes fleet views and browser-local alert previews.
demo.vaanieval.com illustrates them with a curated
snapshot. This is not a hosted monitoring service: rules are not delivered to
email, Slack or webhooks, and do not run as background notifications.
The fleet dashboard
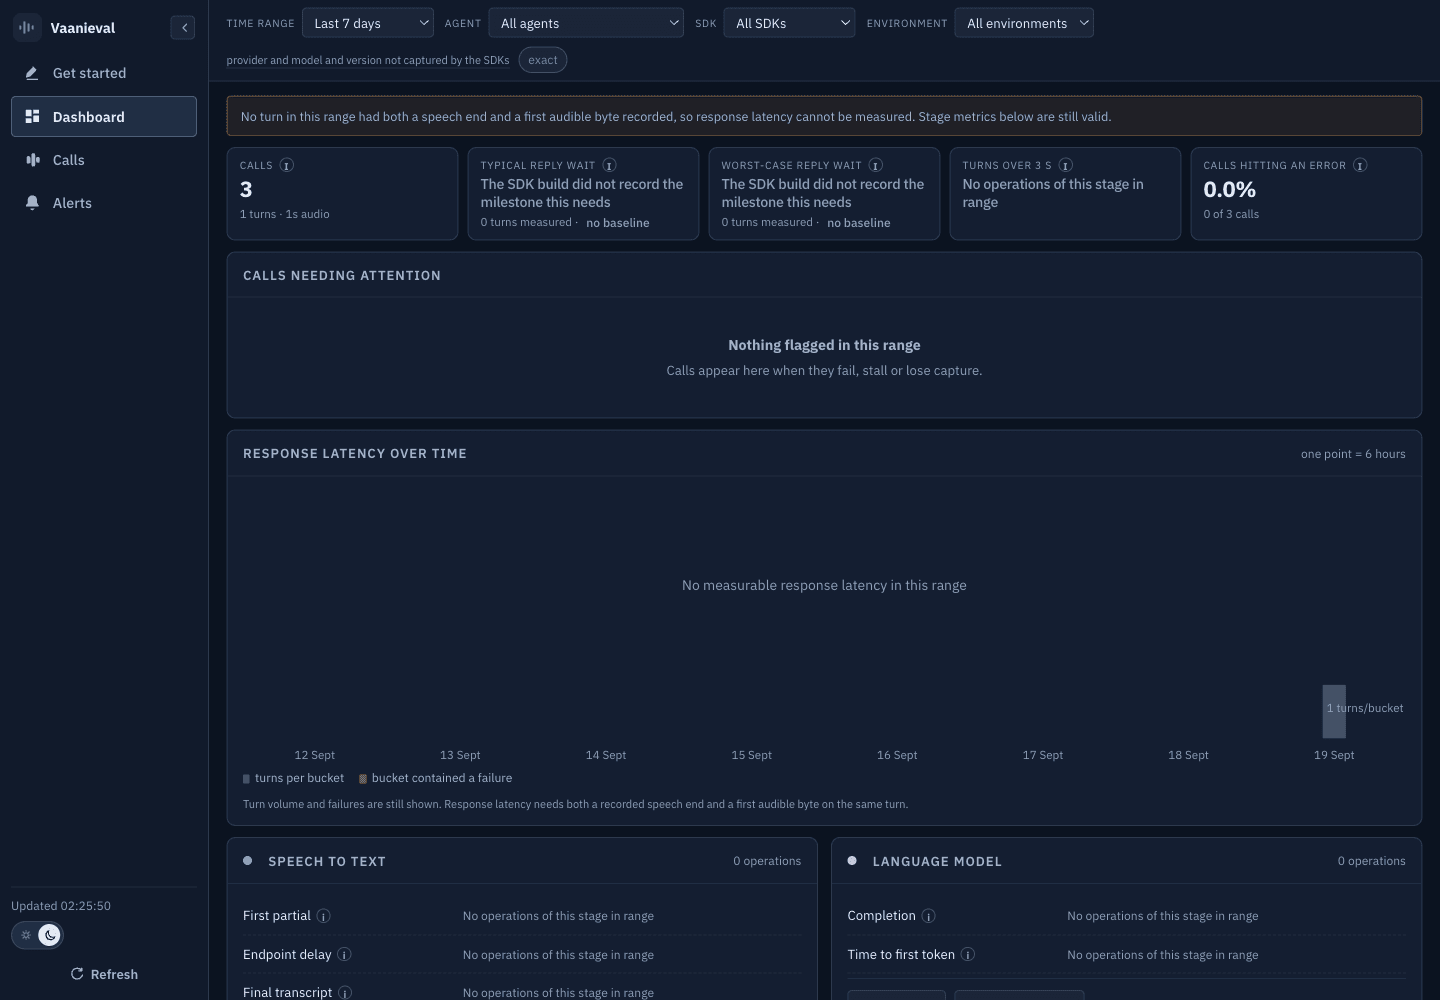
The screenshot uses synthetic tool-only fixtures, not hosted customer data. No provider calls were made; unavailable voice metrics are expected.
Five KPI cards over a filtered set of calls:
| Card | Question it answers |
|---|---|
| Calls | How much traffic is in this view |
| Typical reply wait | What a normal caller experiences |
| Worst-case reply wait | What an unlucky caller experiences |
| Turns over 3s | How often the agent felt slow |
| Calls hitting an error | How often something actually broke |
Filters: time range, agent, provider, model, SDK, environment and version — all
sourced from the metadata you set on the session. Set those consistently on day
one; they are the difference between "latency went up" and "latency went up on
version 2026.08.1, only on the eu-west-1 agent".
Every number publishes its denominator
The screenshot has three calls but no measured response latency. Call count alone is not a denominator of measurable voice turns, and the missing latency must not be interpreted as zero or healthy.
A p95 over 75 measured turns and a p95 over 75,000 are different claims, and the product refuses to render them identically. If the measurable percentage is low, fix your instrumentation before you trust the percentile — a turn missing a milestone is excluded rather than estimated.
Comparison to a previous period is suppressed entirely when there is not enough history, rather than showing a meaningless arrow.
Calls needing attention
The table below the cards is the actual answer to "what should I look at?". It ranks in three classes, then by magnitude within each class:
Failed
A recorded operation failed (excluding recognised cancellation). This is evidence to investigate, not proof that the caller heard an error; retries may recover.
Unverifiable
Capture is incomplete, so we cannot say what the caller heard. The session landed
as partial, or capture_status reports dropped events or audio.
Slow
A measured reply wait exceeded a threshold. This does not establish that the rest of the call was correct.
Unverifiable is deliberately its own class, ranked above slow. "We do not know what happened" is a different statement from "it was slow", and folding it into a healthy bucket would hide exactly the calls most likely to contain a problem. It is also the metric that tells you your instrumentation is incomplete.
Each row carries the reason it was flagged, and opening it lands on the turn that caused the flag rather than the top of the call.
Browser-local alert previews
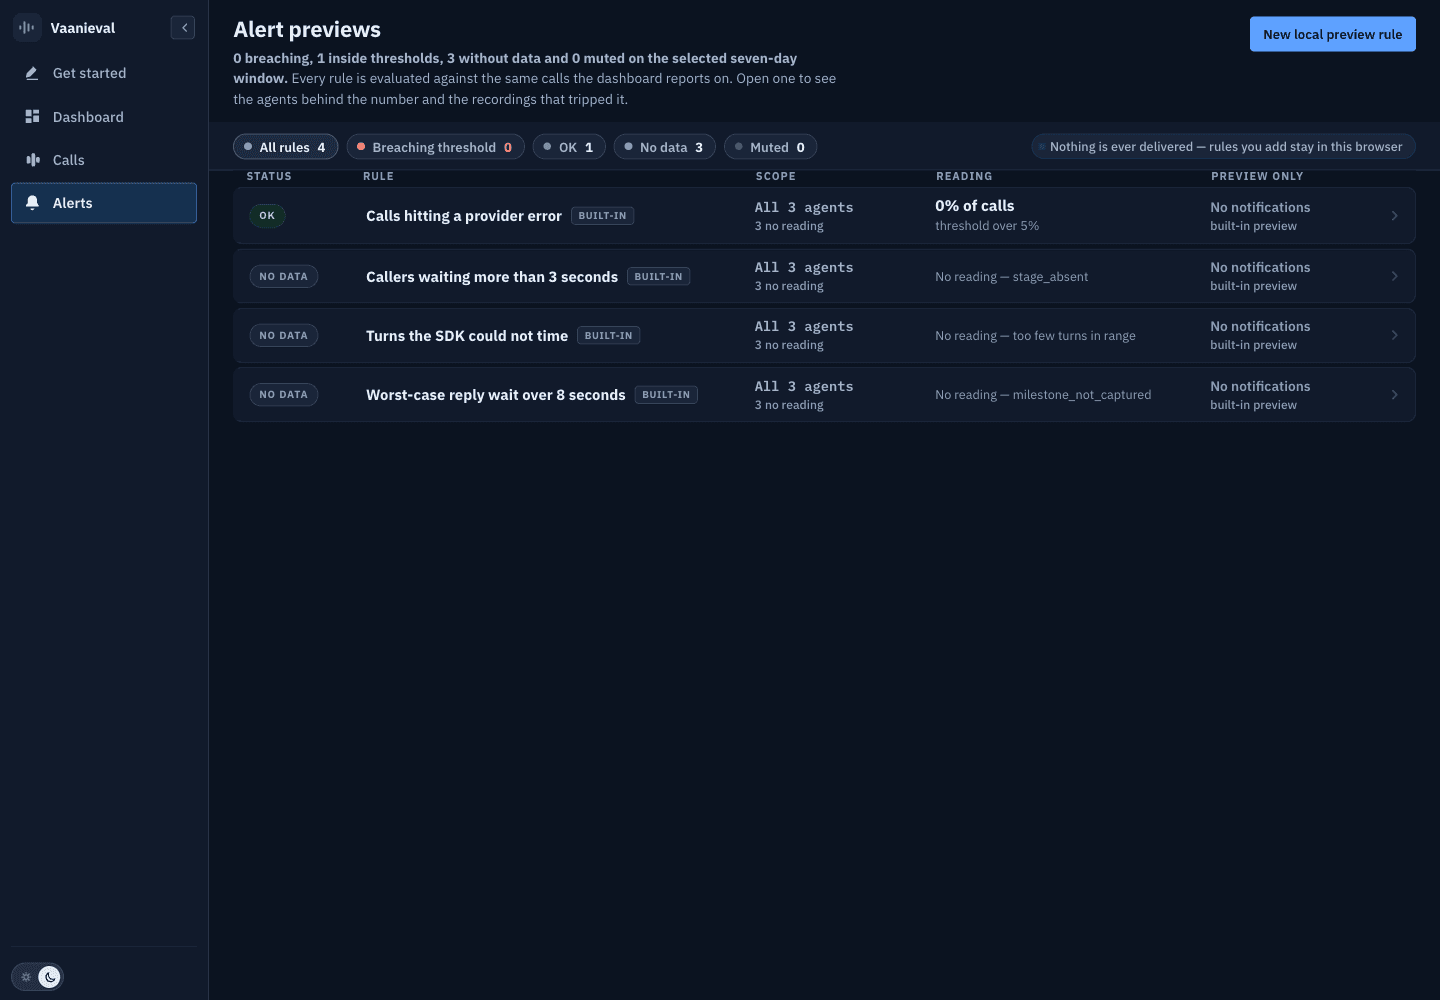
Rules preview thresholds against the calls currently available to the dashboard. Scope, filters and measurement coverage affect a reading; a preview is not a reliable background monitor.
The screenshot contains no configured rules. For rules you add locally, inspect:
- Scope — how many agents it applies to, and how many have no reading
- Reading against threshold — the current value and the line it crossed
- Destination — a preview label only; no delivery integration is connected
Rules are stored in this browser. They are not shared team configuration and can disappear when browser storage is cleared. Closing the page does not leave a notification worker running.
"No reading" is reported, not assumed healthy. A rule that cannot evaluate on an agent — because there were no calls, or too few measurable turns — says so explicitly. Do not interpret an absent reading as evidence that the agent is healthy.
Thresholds to explore
Based on the classes the product already computes:
| Rule | Why |
|---|---|
| Reply wait p95 above your target | The headline caller experience |
| Error rate above a baseline | Something is actually broken |
| Unverifiable rate above a baseline | Your capture is degrading — often the first sign of a deploy problem |
| Measurable-turn percentage below a floor | Instrumentation regressed |
| Worst-case reply wait above a hard ceiling | Catches tail failures a p95 hides |
Preview limitations and scaling tradeoffs
- Thresholds are per-rule, not per-agent-baseline. An agent with a genuinely different latency profile needs its own rule or its own scope, or it will produce misleading previews.
- Percentile alerts on thin traffic are noisy. A p95 over a handful of turns moves a lot. Inspect sample size rather than treating a firing preview as a confirmed regression.
- Data is post-call. Sessions become available after upload, so the preview cannot warn about a call in progress.
- Nothing is delivered, locally or in the demo. Browser storage is not a durable team rule store. Production monitoring needs separate scheduling, delivery, access controls and failure handling; those are not supplied here.
How this fits together
Each step narrows the investigation. You must open the dashboard to inspect the preview; it does not tell you about changes while you are away.
Next
Reading a call
How to go from "this call went wrong" to "this stage caused it" using the waveform, the transcript and the trace.
STT evaluation
Optional external comparison of recorded caller audio and production transcripts — model disagreement, streaming timing, semantic-risk judging and cost limitations.